Category: Research

  • Ethereum ETFs Trading at 25% Undervaluation

    The sole difference between holding Ethereum tokens and ETFs is that the latter does not give you staking benefits because anyone who buys Ethereum directly from crypto exchanges gets around 4% of staking rewards each year on top of token appreciation.

    As a result, Ethereum ETFs are seeing deep undervalued prices and currently, the US Ethereum ETFs are trading at a 25% undervaluation.

    Otherwise, Ethereum would have been the top altcoin ETF bringing in much-needed flows into its markets.

    Ethereum ETFs Are Extremely Undervalued

    Ethereum ETF Flows Since 17 March 2025
    Ethereum ETF Flows Since 17 March 2025

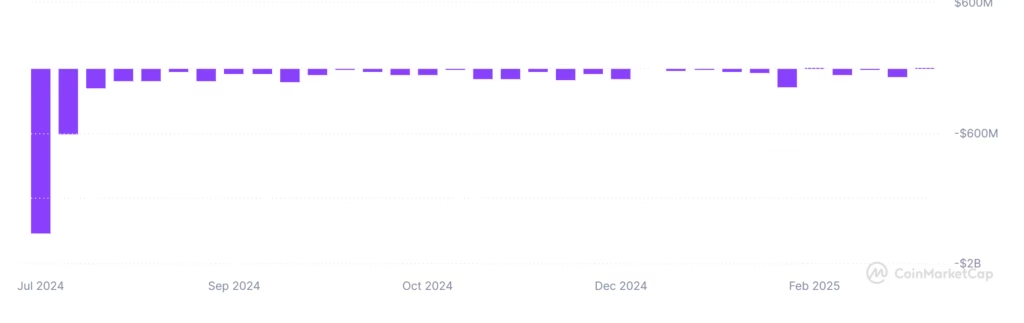
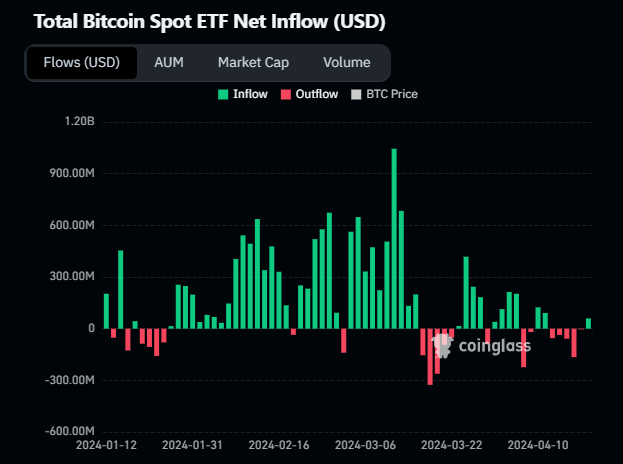
    In the last 14 days, Ethereum ETFs have seen a wild amount of inflows shrinking to $6.68 billion in market cap while their AUM is at $8.81 billion. This 25% undervaluation is a bit worrying because, in the broader markets, (both stock and crypto) high undervaluations signal an extremely bearish phase.

    Ethereum ETFs Need to Provide Staking Benefits or Risk it All

    Ethereum relies on a proof-of-stake consensus algorithm to secure its network. This means that the more people stake in Ethereum, the more secure it becomes. In return, the Ethereum blockchain offers rewards and newly minted tokens.

    In other words, staking simply gets you extra money and ETFs do not offer staking at this point. As a result, people do not wish to buy Ethereum ETFs.

    If the staking benefits are passed on to ETF buyers, then Ethereum ETFs could attract more buyers for the same reason why Bitcoin ETFs. To achieve that, the ETF issuers must file an amended ETF resubmission with the SEC.

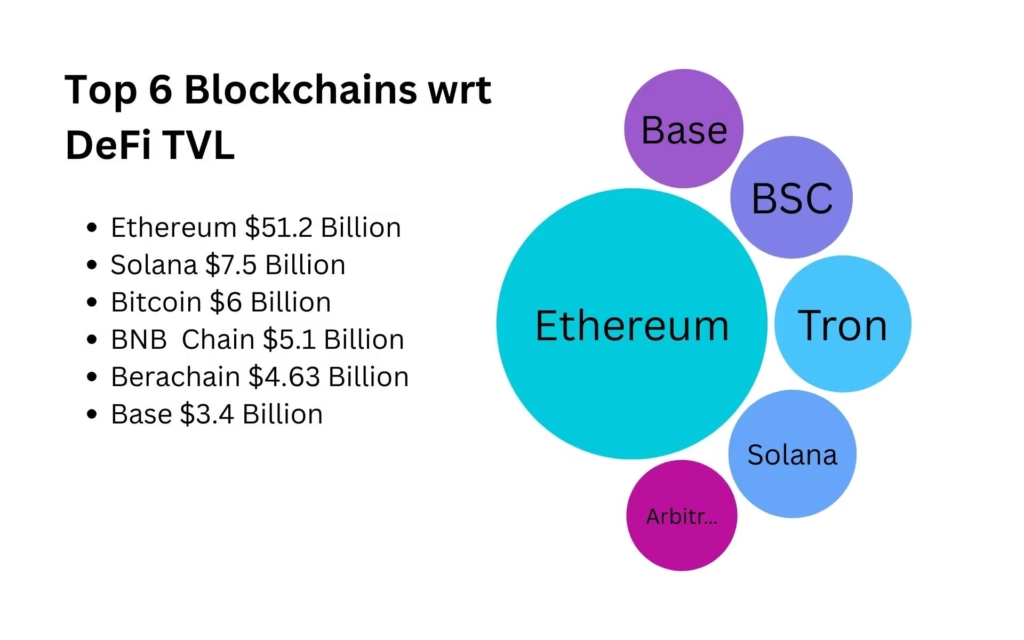
    Ethereum Still Has Strongest Fundamentals

    Highest Liquidity

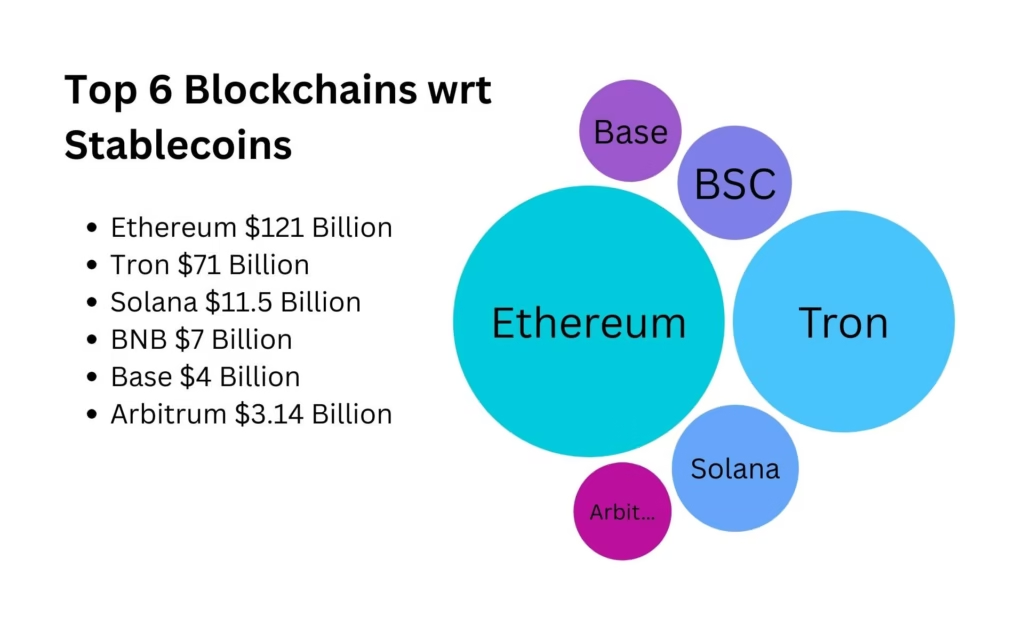
    With respect to the value of stablecoins on its chain, Ethereum has around $120 billion worth of stablecoins, beating the next largest one by a $50 billion margin.

    Stablecoins bring liquidity to the markets and are essential for investing and trading in any crypto.

    Ethereum Stablecoins vs Others in March 2025

    Highest Fee Revenue

    Ethereum collected the largest revenue in 2024 among all blockchains at $2.5 billion, around 16% higher than the second largest, Tron.

    Ethereum Leads in Revenue at $2.5 Bn in 2024, Highest Among all Chains
    Ethereum Leads in Revenue at $2.5 Bn in 2024, Highest Among all Chains

    Will Trump Alter ETF Terms via SEC?

    Trump is a DeFi millionaire himself (after NFTs, $TRUMP, $MELANIA, and his son’s WLFI), and it is likely that he might have considered this path. However, as a Trump observer since 2016, I expect him to act when Ethereum is at its lowest and he himself has set his own position right (through Derivatives or Spot buying).

    To pass staking rewards to the ETF buyers, the SEC’s nod remains a critical step. With pro-crypto candidate Paul Atkins’s takeover, we expect this task to end soon.

    Frequently Asked Questions

    How many Ethereum ETFs are there?

    There are 17 Ethereum ETFs, out of which 13 are in the USA. These 17 ETFs are:
    1. iShares Ethereum Trust
    2. 21Shares Core Ethereum ETF
    3. Fidelity Ethereum Fund
    4. Grayscale Ethereum Trust ETF
    5. Franklin Ethereum Fund
    6. Direxion
    7. Proshares Ethereum ETF
    8. WidomTree Investments Ethereum ETF
    9. Van Eck Ethereum ETF
    10. Bitwise Ethereum ETH
    11. Ark 21 Shares Active Bitcoin Ethereum Strategy Fund
    12. Coinshares Valkyrie Bitcoin and Ether Strategy ETF
    13. CoinShares International Ethereum ETF
    14. Invesco Galaxy Ethereum ETF
    15. Grayscale Ethereum Mini Trust ETF
    16. ARK 21Shares Active Ethereum Futures Strategy ETF
    17. 21S AFTM

  • The Strategy Effect: How Much Bitcoin Did Corporates Buy This Week?

    This week five companies together bought 7697.3 Bitcoins worth $670 million. Out of these, The Blockchain Group and KULR Technologies are new players, while Metaplanet started buying Bitcoins in 2024 and Strategy (formerly MicroStrategy).

    Listen to the Summary as an Audio Podcast.

    1. KULR Technologies – 56.3 BTC

    KULR Technologies, a leading lithium battery manufacturer has turned out to be one of the first hardware manufacturers to buy Bitcoin. This week, it has bought roughly 56.3 Bitcoins.

    KULR has been buying Bitcoins since December 2024 when its corporate strategy gave permission to its executives to acquire Bitcoin with as much as 90% of its cash reserves. Since then, the company has utilized its surplus cash reserves to acquire as much as 668 BTC (incl. the latest purchase).

    Previously, corporate Bitcoin buyers were limited to software, fintech, crypto, and finance.

    2. Strategy (Michael Saylor) – 6,911 BTC

    Strategy (formerly MicroStrategy) has emerged as a Bitcoin pioneer with its latest purchase of 6,911 Bitcoins. This purchase takes its total reserves to 506,137 Bitcoins valued at $44 billion. The company is not sitting on a 30% yield till date which is roughly $10 billion in just yield.

    Michael Saylor is the original OG of Bitcoin buying with 509k Bitcoins bought to date and had financed the entire purchase on debt. In the crypto winter, he did not sell his Bitcoins despite sitting on a $1 billion negative yield.

    MicroStrategy (now Strategy) did that and has been sitting on a $44 billion reserve that includes $10 billion in yield to date. It was the original pioneer of corporate Bitcoin buying in the world.

    3. The Blockchain Group

    French digital assets company, The Blockchain Group has spent roughly $50 million in buying 580 Bitcoins, taking its tally to 620 BTC. The player from France has emerged as the latest corporate buyer of Bitcoins.

    4. Metaplanet Japan – 150 BTC

    Metaplanet was a key pioneer in purchasing Bitcoins following the footsteps of Michael Saylor (and MicroStrategy) in 2024. The company has been raising funds to actively buy Bitcoins since the crypto markets are in a corrective mode.

    Metaplanet bought 150 Bitcoins this week, taking its tally to a total of 3350 BTC. The purchase was roughly made at a price of $85k.

    Upcoming: GameStop (Raising $1.3 bn)

    GameStop announced its desire to raise $1.3 billion in preferred shares for its willingness to purchase Bitcoins. If the company successfully raises this amount within the first half of April 2025 assuming Bitcoin would still be around $90k, it would be buying roughly 14,444 Bitcoins.

    We are still trying to find out why GameStop would need to raise funds to buy Bitcoins when it already has a $4.5 billion cash pile. Maybe this is the better way ahead: buying Bitcoins with borrowed assets, then paying off the debt or converting the money into shares.

    Frequently Asked Questions

    Why are corporates buying Bitcoins?

    Corporates are buying Bitcoins to either to make a yield like Michael Saylor’s Strategy or to make better use of their idle funds, like GameStop.

    Does the law allow corporates to invest in Bitcoins?

    The law in many countries regards Bitcoin as an asset, and by the same, any company can buy any asset as long as it is not outrightly prohibited.

    How many MSTR Shares for 1 Bitcoin?

    As per the latest available data, each Bitcoin ($87k) is equivalent to 268 MSTR shares ($325).

  • Data Proves Ethereum Is The Real Market Leader

    Ethereum has been behaving irrationally despite having the following things to its advantage.

    Ethereum had the highest blockchain revenue in 2024 ($2.5 billion), beating all other cryptocurrencies like Tron, Bitcoin, and Solana.

    Top 6 Blockchains wrt Fee Earned

    The number of dApps on Ethereum is far greater than the number of dApps on other chains like Solana but comparable to BNB.

    Top 6 Blockchains wrt dApps

    Ethereum’s TVL is at $50.8 billion, about 700% higher than the nearest competitor i.e., Solana ($2.5 billion).

    The amount of liquidity that exists on Ethereum is also far greater than other blockchains at $120 billion. Comparatively, Tron has $62 billion of stablecoins and Solana at $11.5 billion.

    Why is Ethereum Not The #1 Crypto?

    Ethereum should have been the largest cryptocurrency but is way behind Bitcoin at a fraction of its price. There are some rational reasons like corporate support for Bitcoin (which companies thought as the Digital Gold). But there are a few irrational factors too, like Attention Economics.

    The Grayscale Ethereum Trust

    Grayscale Ethereum ETF Net Flows
    Grayscale Ethereum ETF Net Flows Since Launch

    Ethereum’s price has been under selling pressure since the ETF approval. Unlike the Bitcoin ETF, Ethereum ETFs saw wide selling due to one major factor.

    The Grayscale Ethereum Trust had amassed $2 billion worth of investments through the sale of its shares. It had a very high fee of 2.5%, which was 10x higher than the fees charged by Ethereum ETFs like BlackRock’s ETHA. As a result, those who had bought Grayscale Trust sold their shares.

    This led to a series of redemptions at a point when Ethereum had just touched a high of $4000. Seeing a shorting opportunity based on the Grayscale ETF induced sell-off, crypto markets saw a deep correction in Ethereum, plunging it to $3000 levels in no time.

    Disconnect With the Crypto Market Sentiments

    Another major reason why Ethereum faced a serious price challenge was its disconnect with the aspirations of broader crypto markets.

    To be honest, most first-time crypto users (who form the bulk of the markets) have just entered it to make big profits. For them, cryptocurrencies like Ethereum, Polygon, Arbitrum, or Algorand made little sense. This is why most of them moved towards memecoins, and later towards PumpFun (memecoin creation tool on Solana) to launch their own tokens. This phenomenon is termed as Attention Economics.

    Bitcoin had corporate support via ETFs, which was absent in the case of Ethereum. Still, today, most long-term Bitcoin ETF holders are corporate investors who bought them because they cannot show Bitcoin in their balance sheets.

    Lately, as these memecoin buyers exit the markets, the attention is expected to shift towards utility-driven projects like Ethereum once again.

    Exploring Rationality in Irrational Markets

    The worst thing about irrational markets is that they tend to correct when you least expect them to be.

    In the current markets, Ethereum could have been the largest blockchain if we think in rational terms.

    • It has a much wider application than Bitcoin.
    • It has a much larger DeFi TVL than Solana.
    • It has a much more sophisticated and well-tested smart contract technology than Cardano.
    • It has a much higher blockchain revenue than Tron.
    • It has a much higher validator count than all Layer-2s combined.
    • It has reduced its blockchain fees by 95% compared to the pre-Dencun Era.

    Clearly, Ethereum should be the top blockchain when it comes to deploying dApps

    To Invest or Not to Invest

    Ethereum’s long-term prospects are very strong, whether it be its blockchain revenue, user activity, on-chain dapps, DeFi TVL, liquidity metrics, or tokenomics. All indicate that the current status of Ethereum is at its strongest point.

    Media brands several blockchains as “Ethereum-killer”, yet none of them can consistently defeat it in any major metric, be it user growth, revenue, or on-chain TVL.

    Disclaimer: The above report has been made from an informational point of view and is not financial advice. Viewers are advised to seek financial advice before investing.

  • Bitcoin’s 2024 Rally Isn’t Over, Expect Sluggish Price in Short Term

    Several data points have emerged in the recent past that clearly shows Bitcoin’s 2024 rally is far from over. Data points from Rekt Capital, Ali Charts, Decentrader and Blockchain Lab confirms that Bitcoin is poised to climb much higher in 2024, than the levels that we see now.

    Bitcoin Outside of Danger Zone

    On May 02, 2024, Rekt Capital confirmed that Bitcoin was in a danger zone. This zone corresponded to a phase called post-halving consolidation where the macro-diagonal posed a strong resistance. The phase was indeed marked by high selling pressure and posed a risk for Bitcoin to fall down to $50k.

    This zone was termed as the danger zone by Rekt Capital and is displayed in purple in the image below.

    Finally with the selling phase being over, Bitcoin has now climbed above $60k, which now forms a strong support zone.

    As per the Macro Diagonal theory, this marks the beginning of the resurgence zone which may extend to $90k. It is evident that after each Bitcoin halving there has been multifold returns. The graph below shows the exact percentage returns after each halving in 2012, 2016, and 2020.

    Bitcoin Halving Dates vs Price , Source: Techopedia.com
    Bitcoin Halving Dates vs Price , Source: Techopedia.com

    Bitcoin Funding Rates Turn Neutral From Negative

    Bitcoin funding rates have turned neutral from negative this week. Data from Decentrader shows that on May 05, 2024, funding rates have turned neutral marking the end of bearishness. Subsequently, these funding rates have now turned positive which shows resurgence in the markets.

    Bitcoin Funding Rates from April 25 to May 07, 2024
    Bitcoin Funding Rates from April 25 to May 07, 2024

    #Note: Funding rate refers to the difference in Bitcoin Futures price and Spot price. If funding rates are positive, it means the market is bullish, and if they are negative, it shows a bearish market. The change of funding rates from positive to neutral marks the end of bullishness and change from negative to neutral marks the end of bearishness.

    Don’t Expect A Parabolic Rally Now

    Despite all bullishness, Bitcoin will mostly be under sideways pressure due to a few reasons.

    1. Miner Sales

    Miners still have around $5 billion worth Bitcoins that they might sell at the right moment, possibly during a rally. This selling might keep Bitcoin under pressure for a while. However, we expect the selling to stop by September 2024.

    2. 90 Day Trailing MVRV Ratio

    Historically, whenever MVRV ratio has dropped below its 90 day average, there has been a period of accumulation. This ratio has been used by traders to identify buy zones that ultimately lead to a rally. As of 08 May 2024, the MVRV ratio has just dipped below its 90 day average. See the below chart by Glassnode, shared by Ali Charts.

    3. Decline in Open Interest

    This factor is more of a short term one. The Open Interest has been in a decline since a month ago on 12th April. Both futures and options OI show the same pattern. Typically a reduction in OI with an increase in price shows short covering. Short covering rallies rarely last.

    Bitcoin Futures and Options OI
    Bitcoin Futures and Options OI

    When Bitcoin moved from $56k-$60k between 1st and 3rd May 2024, it was more of a short covering rally since Bitcoin was leveraged at the $58k support zone.

  • Bitcoin ETFs Break 7 Day Outflow Streak, Net Inflows on 3 May at $378 million

    On May 03, 2024, all major US Spot Bitcoin ETFs have recorded a net inflow. This has broken the streak of outflows for the previous 7 days. US Bitcoin ETFs had been witnessing continuous selling pressure due to recent volatility and sell offs by short term investors.

    With BTC’s price falling below the average buying price for short term investors, their selling streak has come to an end.

    Bitcoin ETFs Record Net Inflow of $378 million

    Data by Coinglass shows that on May 03, 2024, all US spot Bitcoin ETFs have recorded a major inflows. This was the first net inflow in about 8 days. Prior to this, there was a net outflow from ETFs which resulted in a selling pressure as ETFs needed to sell their Bitcoins to allow user redemptions.

    Although there were some net buying in the individual ETFs, yet the net outflow was hurting Bitcoin prices.

    Bitcoin ETF Flows from 24 April 2024 to 3 May 2024
    Bitcoin ETF Flows from 24 April 2024 to 3 May 2024

    Grayscale Spot Bitcoin ETF Records First Inflow Since Launch

    The Grayscale Spot Bitcoin ETF was born from Grayscale GBTC Trust. On the date of the approval of spot ETFs, the Grayscale ETF existed as the trust and had a size of $42 billion.

    The availability of new Bitcoin ETFs at lower fees lured investors and the GBTC trust started losing funds at an alarming rate. However, 109 days after the launch of Bitcoin ETFs, the GBTC trust (now Grayscale Spot ETF) has seen a positive inflow of $63 million.

    Despite all, the Grayscale Spot Bitcoin ETF still has the highest assets under management, i.e., $24 billion which is still much ahead of the second largest (BlackRock’s IBIT) which is at $17 billion.

    Here is a comparison of top Spot Bitcoin ETFs by Blockworks.

    Spot Bitcoin ETF Explorer  as on 4 May 2024
    Spot Bitcoin ETF Explorer as on 4 May 2024

    #NOTE: In the US, ETFs are registered as legal trusts and the shares of these trusts are sold in exchanges as ETFs.

    Reasons for Renewed Buying

    Out of several reasons for a renewed buying in Bitcoin, we have identified the top most reasons.

    1. Bitcoin’s price was suppressed mostly due to short term investors who might have exited after their BTC went below their buying price.
    2. Quick recovery in Bitcoin’s price after $55k-$57k acted as a strong buying zone.

    Failed Hong Kong ETFs

    The Hong Kong Bitcoin ETFs failed to perform as the net inflows on the first day of the launch was a little above $8 million as compared to $4.6 billion inflows by US spot ETFs. Even on day 2, the inflows were a meagre $5.56 million vs 1.42 billion by US ETFs on their day 2.

  • Bitcoin’s Selling Pressure Ends as Short Term Investors Exit Markets

    Selling in Bitcoin and overall markets were severe in the last couple of weeks because of short term investors.

    Due to a bull rally prior to Bitcoin Halving, and the lofty targets given by top analysts, several short term investors saw an opportunity to make some quick money.

    However, by the time these investors entered the markets, the prices were already in the overbought zone. When these short term investors entered, the markets were ripe for a correction.

    Bitcoin Price Charts for Short Term
    Bitcoin Price Charts for Short Term

    Geopolitical events like Israel-Iran conflict, US FED interest rates and profit booking triggered a sale in the markets.

    Once selling gained momentum, the short term investors sold completely and most of them likely existed the markets. As soon as the price of Bitcoin went below the average purchase price of short term investors, the selling paused.

    Bitcoin On Chain Data

    A report by Glassnode shows that it is highly likely that these short term investors have exited the markets. The below image shows how short term investors with an average buying age of 1 week – 3 months have likely sold the most. The realized price for purchases done in the last 3 months were $62k.

    Blockchain Lab Accurately Identified Buying Levels

    This was also the support identified by us at Blockchain Lab i.e., $61.3k in the below chart. The reason why we thought the price would act as a support is due to 2 arguments.

    1. Bitcoin’s price would not experience any severe fall due to Bitcoin Halving and due to the presence of Bitcoin ETFs.
    2. Secondly, the trend lines showed that $61.3k was a very strong buying zone. This is why despite the fact that price went below this line, it immediately recovered.
    Bitcoin Supports and Resistances as on 1 May 2024
    Bitcoin Supports and Resistances Identified as on 1 May 2024

    Slow Price Recovery Ahead

    Now that short term investors have likely exited the markets, the price of Bitcoin may jump to $66k. However, we do not expect any large rally to extend unless the resistance at $72.3k is taken out.

    The presence of a huge BTC holding with Bitcoin miners could also keep prices suppressed for a while in the next few months.

  • Bitcoin Below $60k, Might Fall to $50k Soon

    In the last 24 hours starting 8 a.m. UTC on 30th April 2023, we saw a continuous fall in Bitcoin’s price from $63,200 to $57,165. The immediate reasons seemed to be Bitcoin ETF outflows, lackluster debut of Hong Kong Spot Bitcoin ETFs, miner sales and general bearishness in the markets.

    In the last few days, there has been severe consolidation in the broader markets which have left investors and traders confused as to what should be done next. In this article, we use on-chain data, fundamental metrics and technical charts to understand what could be the best course of action for the near foreseeable future.

    Bitcoin Outflow Intensifies

    US Spot Bitcoin ETFs had seen a major outflow in the last day i.e., 30 April 2024. There was $3.60 million in inflows and total outflows stood $165.20 million. at causing a net outflow of $161.60 million.

    The only Bitcoin ETF with any inflow was ArkInvest which saw $3.60 million of inflows.

    The individual outflows in and out of major Bitcoin ETFs are:

    • GBTC -$93.2 million
    • FBTC -$35.30 million
    • BITB -$34.30 million
    • BTCO -$2.40 million

    Other major Bitcoin ETFs did not see any outflows but also had zero inflow.

    A look at the trend of Bitcoin ETF flows shows that after mid-march the markets entered a profit booking mode. Net inflows slowly dropped to zero and outflows began. Still, the outflows are not as severe as they could have been, thanks to the reduced supply of Bitcoin after halving which seems to have held the price.

    Lackluster Debut of Hong Kong ETFs

    The Hong Kong ETF failed to attract investors in the Asian markets. On the first day of debut, April 29th, the net inflows were at $8 million as compared to $4.6 billion in US Spot Bitcoin ETFs on their first day.

    The lackluster performance can be attributed to the following figures:

    • Market trends
    • Bearish market sentiments
    • Excess of Bitcoins in the market
    • Availability of spot ETFs in the US which is one of the primary demand sources for Bitcoin
    • The crypto crackdown in China in the past

    Among all reasons, we believe that the crypto crackdown in China that took place around September 2021 could be a major reason for holding investors back.

    Main landers(people from mainland China) comprise a major chunk of general as well as investor population in the Hong Kong. The increase in main lander investors within Hong Kong rose majorly after the post-covid housing crisis in mainland China.

    A report by Nikkei Asia shows that 80% of inflow of people that settled in Hong Kong were from Mainland China. A special policy of “one-way permit” allows Chinese mainlanders to settle in Hong Kong along with their families.

    Since most of them have connections that tie them back to mainland China, they might get hesitant in investing in Bitcoin or any cryptocurrencies even in the form of ETFs.

    Miner Sales and General Bearishness

    Bitcoin miners might be forced to sell their mined Bitcoins to cover operational costs as well as to realize some profits.

    As per an estimate by 10x Research, miners could have been sitting on $5.2 billion worth of Bitcoins. The same report indicates that the miner holdings are alone sufficient to keep prices suppressed in the coming 6 months.

    The miner sales would not have been these worse if the general market trends had been a little better.

    The markets witnessed a net fall in Bitcoin’s price in April 2023. After starting near $69k, the markets corrected for the first week. A relief rally in the second week failed after Bitcoin couldn’t cross $70k.

    Bitcoin Charts Looks Severely Bearish for May 2024

    As on 1 May 2024, Bitcoin’s price crashed 8% on a single day, falling to $58k.

    A look at the daily charts signal that prices may fall further.

    After a failed test of resistance at $73.2k, Bitcoin priced had found support between $61k-$62k. However, on May 01, 2024, the price also broke down below this support. Now the next support seems at $50.6k.

    Bitcoin Supports and Resistances as on 1 May 2024
    Bitcoin Supports and Resistances as on 1 May 2024

    Option Data Confirms Bearishness

    Options data for Bitcoin shows that the markets are severely bearish. At a put/call ratio of 0.5, the markets are far more bearish than any time in 2024.

    Bitcoin Put/Call Ratio as on 1 May 2024 from Coinglass
    Bitcoin Put/Call Ratio as on 1 May 2024 from Coinglass

    Put/Call ratio is the comparision between put options (which signal bullishness) and call options (which signal bearishness). Ratio above 1 shows that the markets are bullish and if below 1, they indicate severe bearishness.

    Disclaimer: The above analysis is from an educational perspective and should not be taken as financial advice.

  • Altcoins Expecting a Super Rally Led by Bitcoin in 2024

    We might soon witness a super rally in almost all major altcoins. We expect a rally in the future because a post-halving rally in Bitcoin is due. Though, there are a few factors that are delaying the Bitcoin and an altcoin rally. However, we expect them to end between Aug- Oct 2024.

    Altcoins Rally Ahead as Bitcoin Enters Post Halving Phase

    The Bitcoin post-halving rally might trigger a rally in the altcoins too.

    When Bitcoin rallied from $30,000 (June 2023) to $72,300 (April 2024), we also witnessed a similar rally in altcoins too.

    • Ethereum rallied from $1900 to $4100.
    • Dogecoin tripled from $0.07 to $0.22.
    • Solana gave 13x returns from $14 to $200.
    • Shiba Inu went 3x from $0.000008 to $0.000024.
    • dogwifhat rose 15x from $0.3 to $4.5.

    Now considering this was the impact of a pre-halving rally, let us assess what could a post halving rally ( which is much greater) could impact altcoins.

    Factors Delaying an Altcoin Rally

    The Altcoin rally is pretty much dependent on the post-halving behavior of Bitcoin which itself is dependent on factors such as miners, US Fed interest rates and others.

    Miners and Their $5 Billion BTC Stash

    Bitcoin miners are estimated currently to have accumulated a stash worth of $5 billion in Bitcoins. Now as the 4th halving reduces their block rewards, they might soon find it difficult to fund operations with a reduced income.

    If Miners Sell Bitcoins

    If Bitcoin miners decide to sell their BTC holdings, an additional $5 billion worth of Bitcoins would enter the markets. As per 10x Research, that amount is sufficient to keep the Bitcoin prices suppressed at current levels ($60k-$70k) for the next 6 months.

    In this scenario, a Bitcoin post halving rally would only materialize in the latter half of 2024, possibly after September.

    If Miners Don’t Sell Bitcoins

    Assuming that miners don’t sell their Bitcoins or even if they sell, they do so at very small amounts, then the number of new Bitcoins entering the markets would be very low.

    In such a scenario, Bitcoin would rally as soon as ETF inflows start pouring in. This could be somewhere in the June – August period.

    US Government Actions

    The US crypto market is the largest market for cryptocurrencies as well as crypto ETFs. The ability of this market to buy Bitcoin depends upon macroeconomic factors like Federal Reserve interest rates, government taxation policies and other policies.

    Federal Reserve Interest Rates

    An increase in interest rates would encourage more people to save, as they can earn higher returns on their savings. Additionally, the higher cost of borrowing would deter people from taking out loans.

    Conversely, a decrease in interest rates would make borrowing cheaper, encouraging more people to take out loans. This increase in borrowing could lead to greater spending and circulation of money in the economy.

    Since Aug 2023, Federal interest rate has been at 5.33%. Being at the highest level since 2009, the high interest rates are forcing people to pay more on their car loans, property loans and student loans. Therefore leaving lesser amount of investable cash with them.

    Despite several macroeconomic problems, the US Fed has been trying to suppress inflation by raising interest rates.

    US Federal Reserve Interest Rates History
    US Federal Reserve Interest Rates History

    However, since Aug 2023, the rates has been constant because if interest rates are raised above these levels, it might bring a recession in the US economy.

    NOTE: Germany and Japan have already entered recession as on 25 April 2024.

    Now, that the inflation is still above their 2% target (3.5% as of March 2024), there is less expectation that the interest rates will fall soon. This leaves little cash with people and stops them from investing.

    US Inflation Rates from March 2020 - March 2024
    US Inflation Rates from March 2020 – March 2024

    New Taxation Policy on Bitcoin Mining

    A new taxation policy might be re-introduced for Bitcoin Miners. The US Government is looking to reintroduce a policy which could raise excise duty to 30% on electricity supplied to the Bitcoin farms.

    Expensive electricity might force Bitcoin miners to either shut their business or relocate somewhere where taxation policies are favorable.

    Mining Difficulty
    Bitcoin Mining
  • Bitcoin Runes Might Outperform Bitcoin Ordinals in 2024

    Bitcoin Runes, another token standard coming out of the Bitcoin network (after BRC-20) has hit the market on 20th April 2023 just at the time of Bitcoin halving. Runes were created by Casey Rodarmor (creator of Bitcoin ordinals) and are based on the Ordinals Theory.

    The protocol helps in the creation and management of memecoins and degens in a way similar to Solana.

    How Bitcoin Ordinals Helped Create Surge in Bitcoin Miner Revenues?

    After the introduction of Bitcoin Ordinals, we saw a huge interest in them from the crypto community. Introduced in December 2022, Ordinals saw a huge boost near May 2023. The number of inscriptions (creation of Ordinals) touched as high as 400k per day.

    The creation of each ordinal was done by inscribing information onto a Satoshi, which was the smallest unit of Bitcoin (1 Bitcoin = 100 million Satoshis).

    Consequently, there was also a boost in the fees paid. Each Ordinals was basically created on a single Satoshi but their transaction fees was similar to transferring ordinary Bitcoins because both of them introduce similar changes in the Bitcoin blockchain.

    Note: Fees in blockchains are calculated based on how much data you are adding to the blockchain.

    Let us simplify it with an hypothetical example. Assume that for the transfer of 1 Bitcoin, it consumes 100 MB of data, and costs $10. So for the transfer of 1 Satoshi it would require 1 byte of data, and a fee of $0.00001. However, since a ordinal is created with adding more data onto a Satoshi, its size increases, to say 10 MB. Hence, the fees could be around $1 (1/10th of Bitcoin in size). But the Satoshi still remains a Satoshi, its value is the same but its transfer fee has increased 10 million times.

    This is how the fee has increased after the introduction of Ordinals.

    Decoding Miner Revenue Increase Due to Ordinals

    Now an increased fee would also mean an increase in miner revenues as each Bitcoin Ordinal would have to go through the verification process similar to an ordinary transaction.

    All in all, Bitcoin Ordinals helped miners make approximately $451 million in just fees. Also the value of miner stocks went up by 100%-300%.

    Will the Same Story Repeat for Bitcoin Runes?

    Yes, let me explain why. Casey Rodarmor has created Bitcoin Runes to help developers create memecoins which are easier to create, deploy and manage.

    We expect Bitcoin Runes to have a similar or even a stronger performance than Bitcoin Ordinals. The reason is due to the high demand in the Memecoin markets.

    Lately, memecoins have been the largest gainers in the crypto markets. Traditional memecoins like Dogecoin and Shiba Inu, have been trading at nearly 2x-3x prices as compared to the past year. New memecoins like Bonk, Pepe, dogwifhat and many others have also garnered massive number of users.

    The combined net worth of all memecoins stands at $56.8 billion as of 24th April 2024.

    Source CoinMarketCap
    Source: CoinMarketCap

    Now, if the same cryptocurrencies will be created on Bitcoin, they could fetch far more users than any other blockchain. The unmatched security of Bitcoin Network would make these cryptocurrencies more safe than other blockchain.

    Runes vs Ordinals

    Bitcoin Ordinals which were first seen in December 22, 2023 were intended to bring NFT like capabilities to the Bitcoin blockchain. They were created by Casey Rodarmor and used unspent UTXOs to create new cryptocurrencies.

    On the other hand Bitcoin Ordinals are Satoshis on which information is inscribed.

    Detailed Article on Bitcoin Runes: What are Bitcoin Runes? How Do They Work?

  • The 4th Bitcoin Halving Completes, What Now?

    On 20th April 2024, UTC 12:09 am, the Bitcoin network reached a block height of 840,000 and this triggered the Bitcoin Halving event. This reduced the Bitcoin block rewards from 6.25 Bitcoins per block to 3.125 Bitcoins per block. However, there was also a four fold increase in Bitcoin’s block rewards as compared to the third halving event.

    Now that the Bitcoin Halving event has completed. Its finally time to assess what lies ahead now. Turbulent markets, macroeconomics and troubled geopolitics seem to present a lot of challenges ahead.

    Facts About The 4th Bitcoin Halving

    • Old Block Reward was 6.25 BTC per block.
    • New Block Reward at 3.125 BTC per block.
    • Timestamp for the 840,000th block was 12:09 am UTC on 20th April 2024.
    • Price of Bitcoin at halving was $63,984.
    • Next (fifth) estimated Bitcoin halving date between Feb 4th and April 17th, 2028.

    Now that the fourth Bitcoin Halving has finally completed, its time to take a look at what happened and assess what lies ahead.

    The halving event took place at 12:09 am UTC on Saturday 20th April 2024 (19th April for the Americas).

    The new block rewards is at 3.125 Bitcoins per block as compared to the old block reward at 6.25 Bitcoins per block. However, there is an increased payout. At the 3rd Bitcoin halving, the price of Bitcoin was at $8618 which means a block reward was valued at $53,862(6.25 BTC x $8618). This increased to over $200k (3.125 BTC x $63,984) after the 4th Bitcoin halving.

    Bitcoin’s Price to Get 3 Setbacks After The Halving

    First Setback: Miners Selling Bitcoins

    It is expected that around $5 billion worth of Bitcoins might be sold by the miners. The Bitcoin miners have been sitting at their miner rewards since quite a long time. Now that block rewards are half (3.125 BTC per block), some of them might be forced to sell their Bitcoin holdings.

    As per 10x Research this selling might keep Bitcoin under pressure for the next 6 months.

    Second Setback: US Government Selling $2 Billion worth Bitcoins

    Another seller who is ready to sell their Bitcoins is the US Government which is estimated to hold roughly $14.7 billion in cryptocurrencies. Out of this, approximately $2 billion worth of Bitcoins have already been moved to Coinbase on 2nd April 2024 for selling in the open market.

    As per Arkham Intelligence, the government funds were those which were seized from Silk Road, a darknet website founded by Ross Ulbricht (now jailed).

    Third Setback: ETF Outflows

    A third setback would be the slowdown in the Spot ETF inflows. Since, their launch, spot ETFs have seen very generous inflows to the tune of $300 million per day. The highest halving recorded till date was on 12th April 2024 when Bitcoin’s price achieved its first all time high in 2024 (previous one was on November 10, 2021).

    However, the inflows had stopped prior to the having. You can see the chart below to get an idea of Spot ETF inflows and outflows.

    Bitcoin Spot ETF Flows, Coinglass.com
    Bitcoin Spot ETF Flows, Coinglass.com

    Bad Macroeconomics to Hurt Bitcoin

    The US Federal Reserve has clearly suggested that they might not cut interest rates in their next meetings. Fed Chairman Jerome Powell said that the recent readings in US inflation was hotter than expected and this would make it difficult to cut rates in the near future.

    Also pointing towards the recent growth data, he said that there were not sufficient steps taken towards achieving the 2% inflation target. Clearly by steps, he meant there could be more rate cuts or neutral policy decisions in the next few FED meetings.

    Currently, the US inflation rate is at 3.5%.

    The dependence on US inflation and interest rates lies because most of the Bitcoin buyers hail from the USA. Also, the US Spot Bitcoin ETFs far outweigh their global competitors in Assets Under Management (AUM).

    Geopolitical Tensions Might Cease Soon

    The Iran-Israel conflict seems to have ended for now. The conflict was a major cause of Bitcoin’s fall in price from $65k to $60k a few days ago.

    Wars and conflicts typically serve to reduce the market’s appetite for fresh buying.

    Fifth Bitcoin Halving Estimated Between 4th Feb 2028 and 17th April 2028

    The next Bitcoin halving which will further decrease block rewards from 3.125 BTC to 1.5625 BTC is expected to happen between the 4th of February 2028 and 17th of April 2028. This is considering the average time between Bitcoin blocks to be between 9.5 to 10 minutes.

    Price Analysis

    Bitcoin Daily Charts as on 20 April 2024
    Bitcoin Daily Charts as on 20 April 2024

    After touching a low of $60k, Bitcoin has now bounced back taking $61k as its new support zone. However, there is a resistance near $73.2k.

    A move above $73.2k would signal a price rally towards $80k followed by $100k. However, we expect the second target of $100k only to materialize towards the end of the second half (Nov-Dec) of 2024.

    A move below $61k would signal a breakdown in prices and Bitcoin might move rapidly towards $50k-$52k which would be a strong buying zone and hence a strong support.

    Disclaimer: This analysis is for educational purposes and should not be considered trading advice.

    FAQ

    What is Bitcoin Halving, How does it Work?

    Bitcoin Halving is the event that reduces the Bitcoin block rewards to half every four years. Previous halvings were in 2012, 2016, 2020 and 2024. The latest one in 2024 reduced the Bitcoin block rewards from 6.25 BTC per block to 3.125 BTC per block. This is done to increase the scarcity of Bitcoins.

    What does Bitcoin Halving mean for investors?

    For investors, Bitcoin halving means profit, as the value of their Bitcoins will increase due to scarcity. Also, it has been observed that a year after every halving, Bitcoin has given phenomenal results to its investors.