Several data points have emerged in the recent past that clearly shows Bitcoin’s 2024 rally is far from over. Data points from Rekt Capital, Ali Charts, Decentrader and Blockchain Lab confirms that Bitcoin is poised to climb much higher in 2024, than the levels that we see now.
Table of Contents
Bitcoin Outside of Danger Zone
On May 02, 2024, Rekt Capital confirmed that Bitcoin was in a danger zone. This zone corresponded to a phase called post-halving consolidation where the macro-diagonal posed a strong resistance. The phase was indeed marked by high selling pressure and posed a risk for Bitcoin to fall down to $50k.
This zone was termed as the danger zone by Rekt Capital and is displayed in purple in the image below.
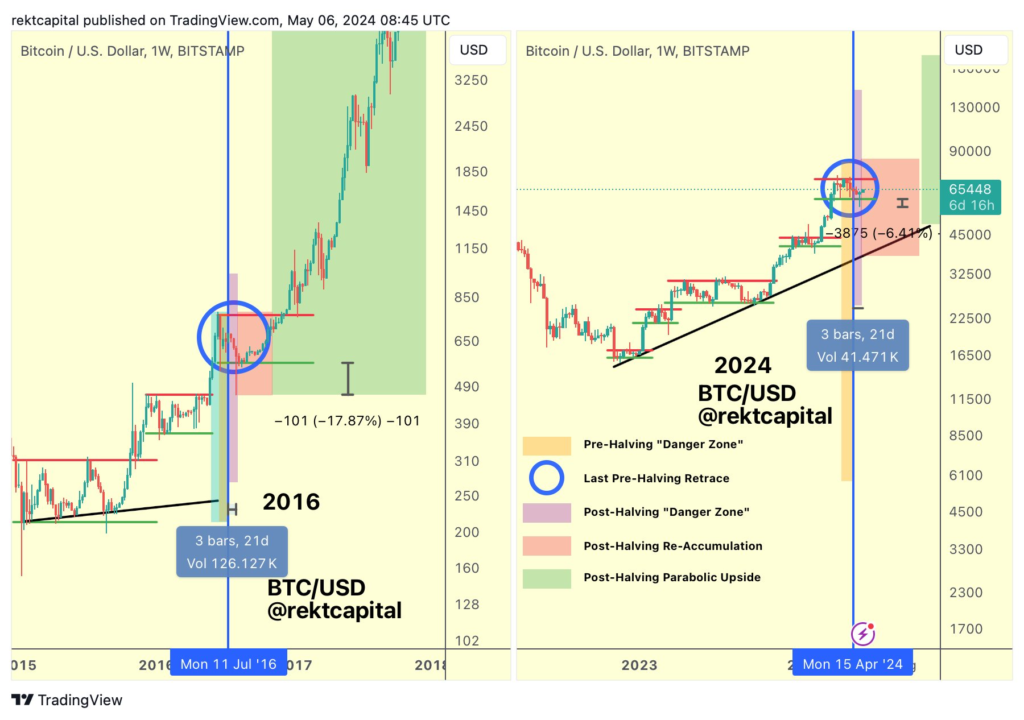
Finally with the selling phase being over, Bitcoin has now climbed above $60k, which now forms a strong support zone.
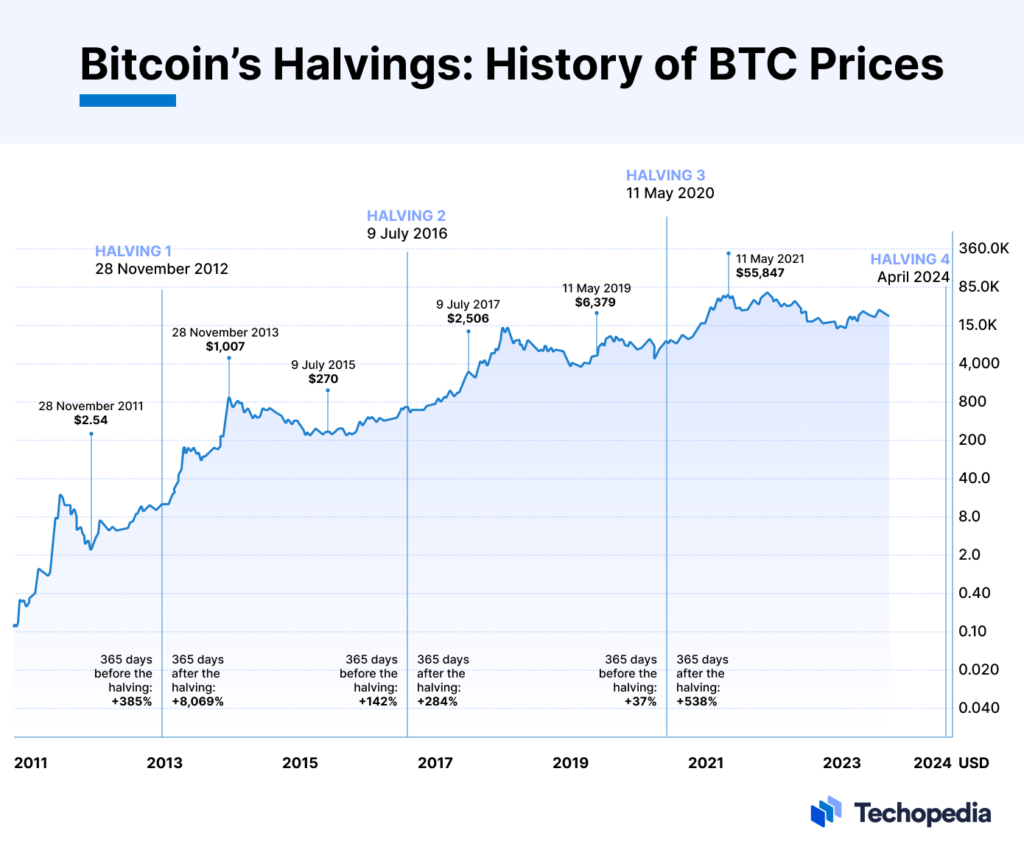
As per the Macro Diagonal theory, this marks the beginning of the resurgence zone which may extend to $90k. It is evident that after each Bitcoin halving there has been multifold returns. The graph below shows the exact percentage returns after each halving in 2012, 2016, and 2020.
Bitcoin Funding Rates Turn Neutral From Negative
Bitcoin funding rates have turned neutral from negative this week. Data from Decentrader shows that on May 05, 2024, funding rates have turned neutral marking the end of bearishness. Subsequently, these funding rates have now turned positive which shows resurgence in the markets.
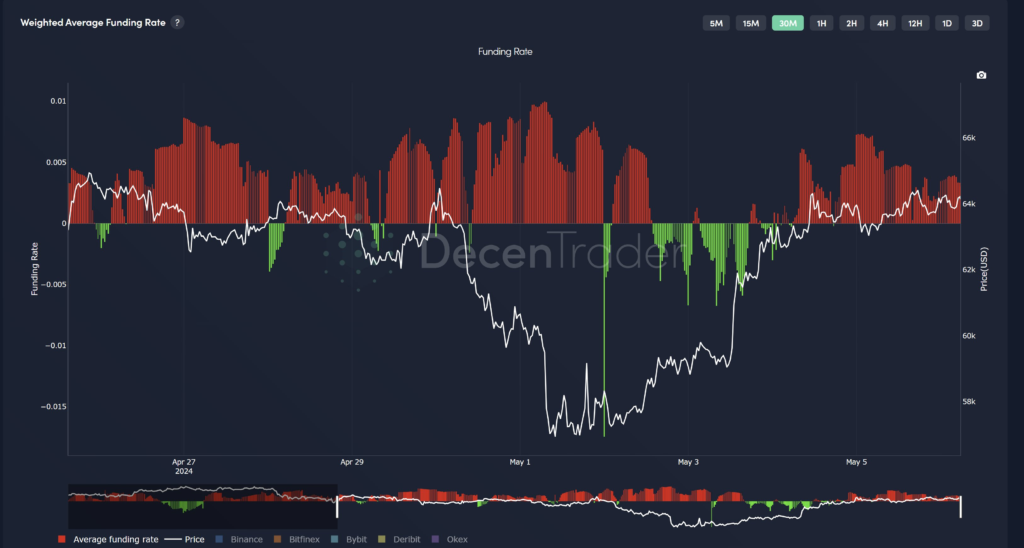
#Note: Funding rate refers to the difference in Bitcoin Futures price and Spot price. If funding rates are positive, it means the market is bullish, and if they are negative, it shows a bearish market. The change of funding rates from positive to neutral marks the end of bullishness and change from negative to neutral marks the end of bearishness.
Don’t Expect A Parabolic Rally Now
Despite all bullishness, Bitcoin will mostly be under sideways pressure due to a few reasons.
1. Miner Sales
Miners still have around $5 billion worth Bitcoins that they might sell at the right moment, possibly during a rally. This selling might keep Bitcoin under pressure for a while. However, we expect the selling to stop by September 2024.
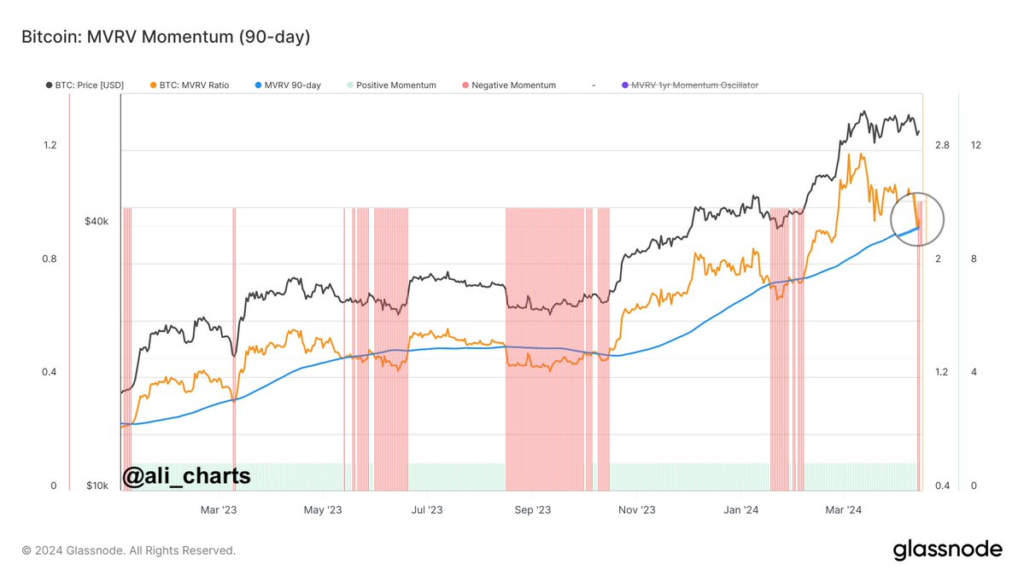
2. 90 Day Trailing MVRV Ratio
Historically, whenever MVRV ratio has dropped below its 90 day average, there has been a period of accumulation. This ratio has been used by traders to identify buy zones that ultimately lead to a rally. As of 08 May 2024, the MVRV ratio has just dipped below its 90 day average. See the below chart by Glassnode, shared by Ali Charts.
3. Decline in Open Interest
This factor is more of a short term one. The Open Interest has been in a decline since a month ago on 12th April. Both futures and options OI show the same pattern. Typically a reduction in OI with an increase in price shows short covering. Short covering rallies rarely last.
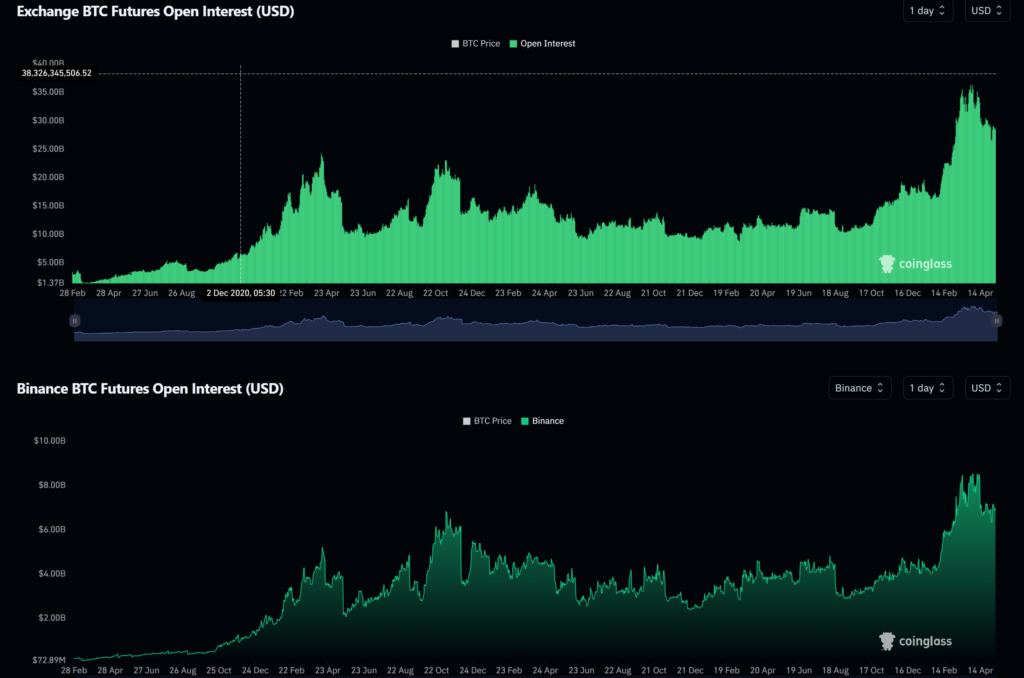
When Bitcoin moved from $56k-$60k between 1st and 3rd May 2024, it was more of a short covering rally since Bitcoin was leveraged at the $58k support zone.