In the last 24 hours starting 8 a.m. UTC on 30th April 2023, we saw a continuous fall in Bitcoin’s price from $63,200 to $57,165. The immediate reasons seemed to be Bitcoin ETF outflows, lackluster debut of Hong Kong Spot Bitcoin ETFs, miner sales and general bearishness in the markets.
In the last few days, there has been severe consolidation in the broader markets which have left investors and traders confused as to what should be done next. In this article, we use on-chain data, fundamental metrics and technical charts to understand what could be the best course of action for the near foreseeable future.
Table of Contents
Bitcoin Outflow Intensifies
US Spot Bitcoin ETFs had seen a major outflow in the last day i.e., 30 April 2024. There was $3.60 million in inflows and total outflows stood $165.20 million. at causing a net outflow of $161.60 million.
The only Bitcoin ETF with any inflow was ArkInvest which saw $3.60 million of inflows.
The individual outflows in and out of major Bitcoin ETFs are:
- GBTC -$93.2 million
- FBTC -$35.30 million
- BITB -$34.30 million
- BTCO -$2.40 million
Other major Bitcoin ETFs did not see any outflows but also had zero inflow.
A look at the trend of Bitcoin ETF flows shows that after mid-march the markets entered a profit booking mode. Net inflows slowly dropped to zero and outflows began. Still, the outflows are not as severe as they could have been, thanks to the reduced supply of Bitcoin after halving which seems to have held the price.

Lackluster Debut of Hong Kong ETFs
The Hong Kong ETF failed to attract investors in the Asian markets. On the first day of debut, April 29th, the net inflows were at $8 million as compared to $4.6 billion in US Spot Bitcoin ETFs on their first day.
The lackluster performance can be attributed to the following figures:
- Market trends
- Bearish market sentiments
- Excess of Bitcoins in the market
- Availability of spot ETFs in the US which is one of the primary demand sources for Bitcoin
- The crypto crackdown in China in the past
Among all reasons, we believe that the crypto crackdown in China that took place around September 2021 could be a major reason for holding investors back.
Main landers(people from mainland China) comprise a major chunk of general as well as investor population in the Hong Kong. The increase in main lander investors within Hong Kong rose majorly after the post-covid housing crisis in mainland China.
A report by Nikkei Asia shows that 80% of inflow of people that settled in Hong Kong were from Mainland China. A special policy of “one-way permit” allows Chinese mainlanders to settle in Hong Kong along with their families.
Since most of them have connections that tie them back to mainland China, they might get hesitant in investing in Bitcoin or any cryptocurrencies even in the form of ETFs.
Miner Sales and General Bearishness
Bitcoin miners might be forced to sell their mined Bitcoins to cover operational costs as well as to realize some profits.
As per an estimate by 10x Research, miners could have been sitting on $5.2 billion worth of Bitcoins. The same report indicates that the miner holdings are alone sufficient to keep prices suppressed in the coming 6 months.
The miner sales would not have been these worse if the general market trends had been a little better.
The markets witnessed a net fall in Bitcoin’s price in April 2023. After starting near $69k, the markets corrected for the first week. A relief rally in the second week failed after Bitcoin couldn’t cross $70k.

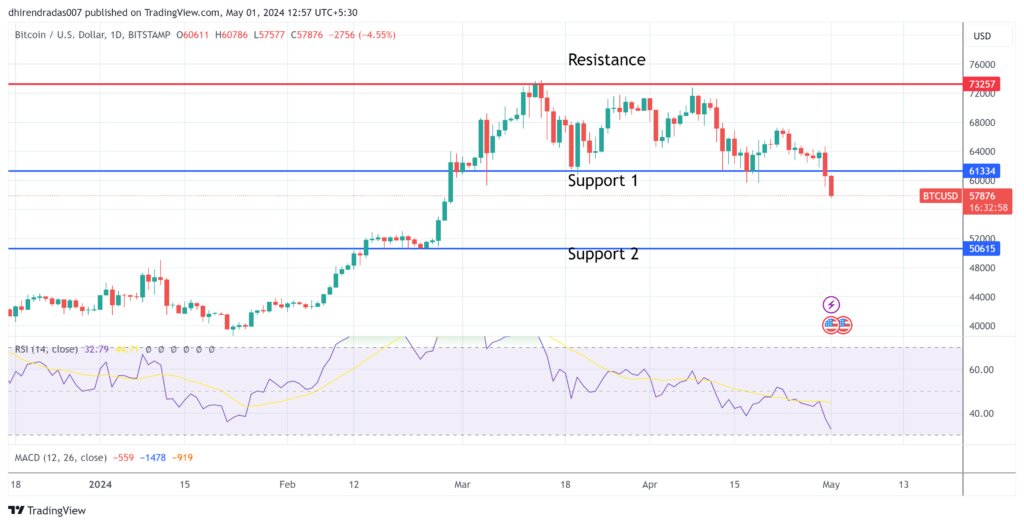
Bitcoin Charts Looks Severely Bearish for May 2024
As on 1 May 2024, Bitcoin’s price crashed 8% on a single day, falling to $58k.
A look at the daily charts signal that prices may fall further.
After a failed test of resistance at $73.2k, Bitcoin priced had found support between $61k-$62k. However, on May 01, 2024, the price also broke down below this support. Now the next support seems at $50.6k.
Option Data Confirms Bearishness
Options data for Bitcoin shows that the markets are severely bearish. At a put/call ratio of 0.5, the markets are far more bearish than any time in 2024.
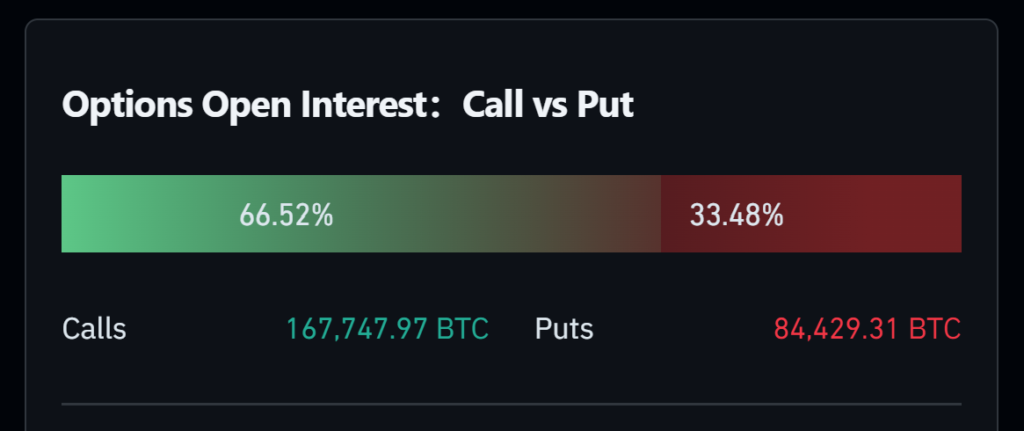
Put/Call ratio is the comparision between put options (which signal bullishness) and call options (which signal bearishness). Ratio above 1 shows that the markets are bullish and if below 1, they indicate severe bearishness.
Disclaimer: The above analysis is from an educational perspective and should not be taken as financial advice.