Category: Research

  • Bitcoin Might Reach $150k by Q3 Due to Supply Shock

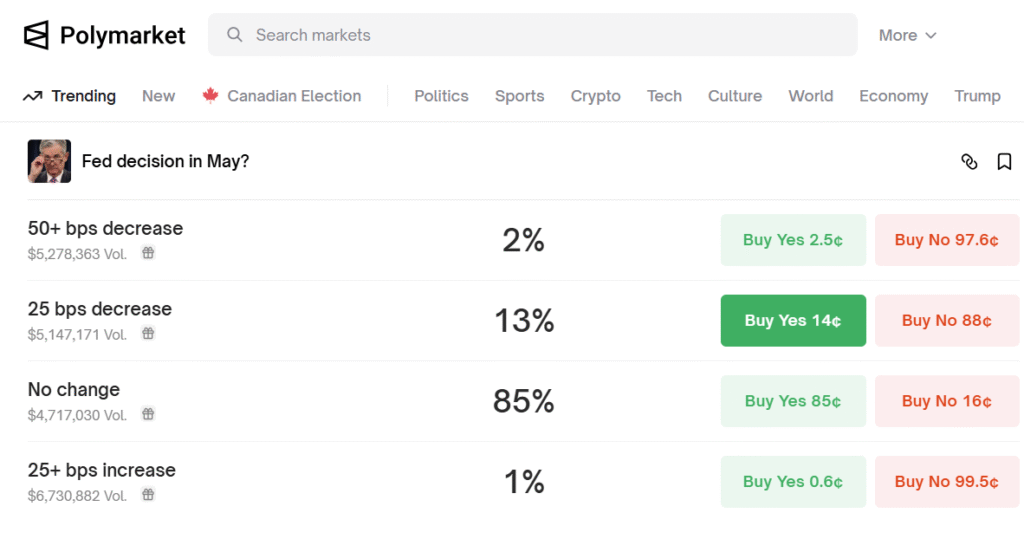
    • The US Fed is expected to introduce a rate cut either at the May 6-7 FOMC meeting or the June 17-18 meeting.
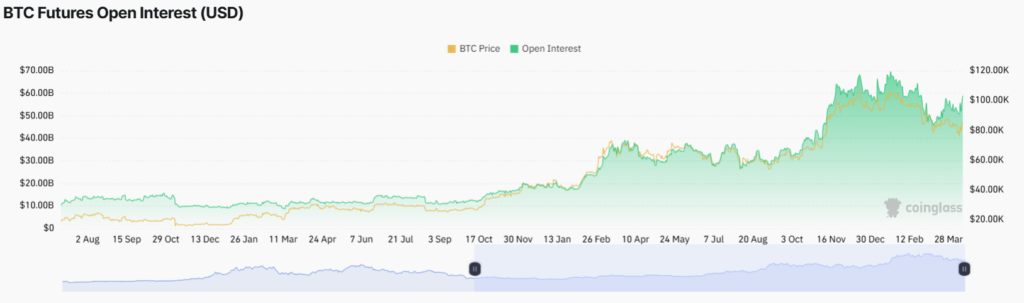
    • Institutions have already been buying with bigger plans in Q2 and Q3.
    • Renewed retail buying of ETFs and spot Bitcoin is expected to take Bitcoin to $150k by September 2025.

    Bitcoin Crosses $90k Decisively

    In what appears to be a short squeeze, Bitcoin has crossed $85k and $90k within the last 48 hours. This move was expected in late April due to the overwhelming buying of Bitcoins by corporate investors.

    Bitcoin Option Strike Prices with Open Interest
    Bitcoin Option Strike Prices with Open Interest

    Unable to find a way out, most short sellers have either liquidated their positions or have shifted higher towards $100k. The highest number of call options (used to short Bitcoin) now lie at $98k, which is expected to fall soon.

    According to put options data, Bitcoin now has a very strong support at $80k and is unlikely to move below these levels even if the US Fed does not make an interest rate cut.

    Recovery Should Last This Time

    The markets have emerged from severe short selling in the last couple of days, and a faint recovery has taken place in top cryptocurrencies.

    Bitcoin Recovers from $84k to $90k in 2 Days
    Bitcoin Recovers from $84k to $90k in 2 Days

    These recoveries are expected to last because of strong whale buying in multiple cryptocurrencies, primarily in Bitcoin. Both crypto native and corporate whales have bought at least $3 billion in the last few weeks.

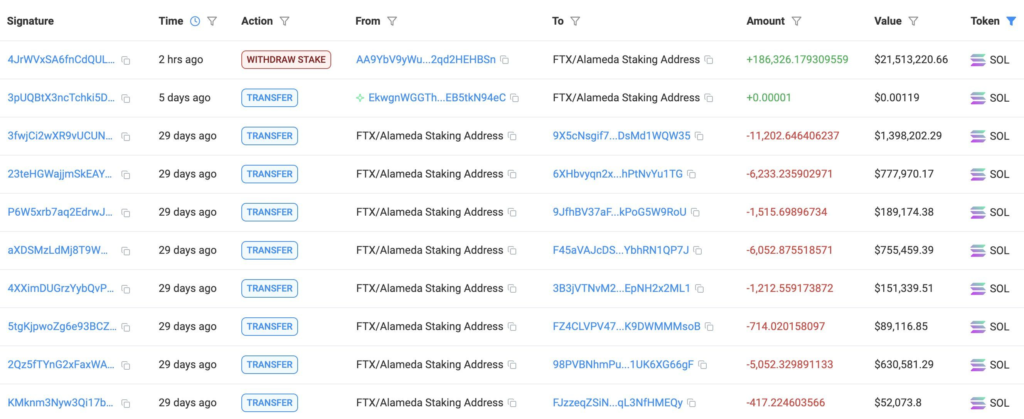
    Further, the risk of China selling Bitcoins has been taken as positive news. Historically, whenever China has tightened Bitcoin regulations, the markets have rallied, be it in 2017 (Bitcoin Mining Ban), 2021 (Bitcoin ban), and 2025 (selling of seized Bitcoin).

    Upcoming Events That Impact Bitcoin’s Price

    The upcoming two Federal Reserve FOMC meetings are expected to aid in the full recovery of crypto markets. The first meeting is to be held on May 6 and 7, while the second meeting is scheduled for June 18 and 19.

    May 6 to 7 FOMC Meeting

    In the next FOMC meeting, i.e., May 6 and 7, the US Federal Reserve is now expected to keep the rates stable despite a demand for a cut from the US Government.

    President Donald Trump and several members of the U.S. Government have raised the demand for Jerome Powell’s removal citing the inability of the US Fed to cut rates amid a similar rate cut in Europe.

    The rate cut in the USA has become urgent because of two reasons, the first being the need to restart US industries for which there is a need of cheap loans, and secondly, the US Government needs to refinance its $7 trillion debt in 2025 which it is unlikely to do at prevailing interest rates of 5.25%.

    June 18 to 19 FOMC Meeting

    If the May FOMC meeting does not cut interest rates, the next one in June is expected to cut them. The US Fed, too, has acknowledged the need for a dovish monetary policy.

    However, if the May 6 to 7 FOMC meeting makes the cut, there is less chance of another rate cut in June to prevent inflation from rising high again.

    Expecting a Supply Shock

    Most of the sellers who had purchased Bitcoin between $80k and $100k in the previous rally are thought to have exited. This exit was visible in the retail market data, where retail ownership in Glassnode’s chart was at its lowest since November 2024.

    Opposite to this, the corporate accumulation has been rising, and as per a Glassnode’s index, corporate accumulation has increased from 0.2 to 0.6.

    Further, there is more interest pouring in from other corporations like Strategy and GameStop, both of whom are yet to make their purchases worth more than $10 billion (combined).

    Since, at present not much of the markets are in selling mode, Bitcoin could see a supply shock as soon as the Fed cuts the interest rates.

  • Market Volumes Crash 74% Since Dec 2024, US Fed Likely Reason

    • Top crypto analyst Markus Thielen brought the attention of the crypto markets to low market activity.
    • The largest traded pair on 18 April was USDC-USDT, both stablecoins.
    • Lack of clarity on US Fed interest rates seems to be the key reason for this stagnancy.
    • The markets might experience high volatility around May 6-7 due to the FOMC meeting.

    Top Market Analyst Brings Attention to Low Activity

    Top crypto analyst and a known figure in crypto markets, Markus Thielen of 10x Research, had shown that the most traded pair on April 18 was the USDC-USDT, both stablecoins.

    Markus Thielen's Data on USDT-USDC Being The Most Traded Pair
    Markus Thielen’s Data on USDT-USDC Being The Most Traded Pair

    #NOTE: The most traded pair yesterday, USDT and USDC, is traded by those who might need to convert their holdings from one chain to another.

    This was further validated by CoinMarketCap data, where USDT was the most traded crypto.

    18th was the Least Active Day in April for the Markets

    The month of April has seen one of the lowest crypto market trading volumes in recent times. Market volumes plummeted from $3 trillion in December 2024 to $1.45 trillion in March 2025. Within the first three weeks of April, these volumes have gone even lower, with $800 billion by April 19th. If this trend continues, CEX volumes for April would see a 20% drop from March levels, plummeting to an estimated $1.2 trillion.

    Monthly Crypto Exchange Volume April 2024 to April 2025
    Monthly Crypto Exchange Volume April 2024 to April 2025

    Within April, the lowest market volume was seen on April 18, which saw a 40% fall from the previous day. The Block’s chart for the 7-day EMA CEX volume as of April 18 was $34.1 billion, falling from $56.3 billion last Saturday, i.e., April 12, 2025.

    7 Day Average CEX Volumes from April 2024 to April 2025
    7-Day Average CEX Volumes from April 2024 to April 2025

    Expecting Volatility by May 7

    The markets might be positioning for an uncertain FOMC meeting outcome on May 7, against previous expectations for a rate cut of 0.25%.

    This change of expectations came after the Fed Chairman Jerome Powell addressed the Economic Club of Chicago, saying that the markets were indeed doing their best and there was no need for a Fed intervention if they plummeted.

    However, economic data indicates that there might be room for at least a 0.25% rate cut as US inflation has plummeted to 2.4% in March, very close to its target of 2% and a considerable fall from 3% in February.

    These mixed indications have confused the markets, most of which expect an uncertain situation at the next FOMC meeting on May 6 to 7. This confusion is also seen in Polymarket data, where users think there is a high possibility of no change in Fed interest rates.

    Polymarket Predictions on Fed Interest Rates on May 7 FOMC Meeting
    Polymarket Predictions on Fed Interest Rates on May 7 FOMC Meeting

    Blockchain Lab’s Opinion

    In our collective experience of over 10 years in the market, we expect huge volatility on May 6 and 7.

    • A no-change in rates might crash the markets temporarily.
    • A 0.25% rate cut could induce a rally in Bitcoin and broader markets. Bitcoin is already above $85k at press time.

    This volatility could send the markets in a directionless manner for a few reasons.

    • Crypto markets have reached an oversold zone.
    • Donald Trump’s push for pro-crypto policies. An insider from the US government indicated that a Crypto Policy could be ready by June.

    Hence, the best action in the current markets would be to either accumulate undervalued cryptos slowly or sit idly.

  • A Tariff War Supports Bitcoin’s Adoption at Dollar’s Expense

    • A prolonged tariff war is likely to isolate global trade, prompting countries to diversify their foreign exchange reserves.
    • Gold is unlikely to keep up with the demand, and Bitcoin has clearly emerged as a substitute.
    • Multiple countries are likely to set up their own Bitcoin Reserves by 2030, as per Richard Teng, CEO of Binance.

    The Current US-Led Trade War Summarized

    Donald Trump has been trying to do turn correct a historical wrong as he tries to implement reciprocal tariffs for each individual country that has taxed the US government at a higher rates as compared to their own material being taxed in the US.

    A few days ago Trump had shared reciprocal tariffs from multiple countries shocking top trading partners like India the European Union the United Kingdom Japan and China. However, soon he lowered the tariffs for all except China, so that each individual nation could negotiate their own trade deal with the United States on better terms.

    However, these tariffs seem to have spooked multiple central banks which have been holding hundreds of billions of US dollars in their forex reserves. One of these banks is the People’s Republic Bank of China. This bank holds almost a trillion of dollars and has the highest dollar reserves of any foreign nation in the world.

    Fearing a trade war and the potential weakening of the US Dollar, the Chinese Central Bank, possibly along with the Japanese, the Indian, and the European Central Banks, are believed to have been trying to minimize their Dollar Reserves and switching to Gold.

    Gold is Unlikely to Keep up with Demand

    In the middle of a global tariff war, gold prices have shot up to an all-time-high of $3300 per ounce (roughly 30 grams).

    However the limited amount of gold available in the world makes it a bad reserve asset for many central banks. Even with a limited tariff war gold has been making 20% to 30% rallies within the past couple of years. As the trade war intensifies we have a doubt that this demand would be met with a supply shock taking the price of gold even higher.

    Bitcoin as a Reserve Asset

    The idea of Bitcoin as a reserve asset could emerge much sooner than previously expected. Several countries like Bhutan, El Salvador, the USA, and China have been building their own Bitcoin reserves for quite a time.

    Lately, Binance CEO Richard Teng has also said in public that their organisation (Binance) has been consulting with many governments to establish independent Bitcoin Reserves.

    https://twitter.com/AsiaGmPump/status/1913147909622964477

    Finally this brings to our initial assumption that a prolonged trade war leading to a de-dollarize world will seek Gold. However, the shortage of Gold is expected to give rise to Bitcoin’s adoption into those treasuries.

  • BTC Targets $106k, Bullish Double Bottom on 1D Charts

    • Bitcoin has formed a bullish double bottom pattern at $76.3k, which seems to be the bottom for the current markets.
    • A double bottom could help Bitcoin cross $88k, a major resistance, ultimately taking it to $106k.
    • Bitcoin has seen strong buying from whales, corporates, and ETFs, whereas retail investors and miners have been selling their holdings.
    • Derivative markets also signal a potential rally with a 10% rise in Open Interest from last month.
    Bitcoin Sees Bullish Double Bottom Pattern on 1D Charts at $76k
    Bitcoin Sees Bullish Double Bottom Pattern on 1D Charts

    Bitcoin’s 1-day charts have seen a strong potential for a rally with the formation of a bullish double bottom pattern. The double bottom pattern could easily take Bitcoin above its next resistance of 88,400, ultimately taking the crypto towards its last ATH of $106,000 (as per 1D closing basis, actual ATH is at $109,114).

    Bitcoin has seen a strong recovery in its market after strike dropped to a low of $76,000. Much of this recovery seems to be aided by strong demand in the corporate sector, with companies like Strategy (MSTR), Metaplanet, Semler Scientific, GameStop, and many others acquiring Bitcoin at an increased pace.

    In the last quarter, Bitcoin has seen a strong fall because of the liquidity crisis in the crypto and stock markets; however, in the current quarter, the US Federal Reserve is expected to cut interest rates by at least 0.25%.

    Fundamental Factors Contributing to Bitcoin’s Rise

    High Whale Demand

    Among whales, both corporate and crypto-native whales have been buying Bitcoin at a high rate. In April, we saw nearly 13k Bitcoins being taken off exchanges.

    Among them, Michael Saylor-led Strategy seems to have the highest contribution, with nearly $3 billion in purchases over the last 45 days.

    Saylor’s followers, namely Metaplanet, GameStop, and Semler Scientific, too, have been buying Bitcoin at a very fast rate. Metaplanet has just raised $10 million, while Semler aims to raise $500 million for BTC acquisition. GameStop, on the other hand, could outrank both of them with a $1.5 billion purchase.

    12.4% Month-on-Month Surge in Open Interest

    Bitcoin features open interest has made a significant recovery from the lows of $45.7 billion, which it reached on March 12, 2025. These were the lowest levels for the year 2025. However, the latest data shows that by April 15, these futures OI had surged to $53.6 billion, recording a 12.4% increase.

    Open Interest shows the net tradeable value of Bitcoins in the Futures market and is a critical indicator of the bearishness or bullishness in the market. Typically, a rising Open Interest is associated with an upcoming rally.

    Strong Corporate Buying

    Several strong corporate houses like Strategy, Metaplanet, Semler Scientific, and GameStop have bought or are about to buy a considerable amount of bitcoins for their own Strategic Reserves. Among them, Strategy has bought $3 billion worth of Bitcoins, Metaplanet is about to buy $10 million BTC (its 4th purchase in April), and GameStop has raised $1.5 billion to buy Bitcoins.

  • Solana Could Hit $175 if it Conquers the Resistance at $135

    • Solana now targets $175 which is its next significant resistance.
    • SOL faces a minor resistance at $135, a price that it failed to reach yesterday.
    • Factors currently supporting Solana are short-covering, whale accumulation, ETF demand, and the possibility of a financial turnaround.

    Solana Technical Analysis

    caSolana’s charts indicate that its price has broken out of a downtrend that has been going on since early January this year. The downtrend took Solana’s price from $294 to $104 within a period of three months. What had caused this downtrend was the end of the memecoin supercycle, the liquidity crisis in the markets, and Solana’s over-reliance on short-term revenue sources.

    Now that Solana has avoided a further crash, its price has taken support at $104. At press time, Solana was at $130 after a failed move to cross $135. Once this minor resistance at $135 is taken out, SOL could easily move to $175 levels. We expect this move to happen around late April.

    By the first week of May 2025 (FOMC meeting), Solana might be ready to cross $200 again. However, this rally would only continue further if SOL has a growth strategy that realigns with the current market preference for utility-based coins like RWA, DePIN, and others.

    What Factors Are Supporting SOL?

    Despite the end of the memecoin supercycle, Solana is still supported by multiple factors:

    • Solana currently has 7.3 million in leveraged shorts at $135, beyond which there could be a short squeeze coming.
    • Solana saw its first spot ETF launch in Canada, with its US counterparts readying a similar launch soon.
    • SOL saw decent whale accumulation in recent times which took benefit of the low price.
    • The markets are expected to make a strong recovery in the coming month as the US Fed is expected to cut interest rates.
    • Finally, Solana might also see a better future if its realignment strategies are carefully implemented.

    The Road Ahead

    Solana’s team took benefit of the entire memecoin supercycle which took Solana from $14 to $294 within a couple of years.

    Further, Solana’s troubles related to the FTX group was solved as FTX and Alameda have very little SOL left to make any large impact.

    However, Solana forgot a basic business strategy of not putting all eggs in one basket. Its over-reliance on memecoins crashed its price down to $104 from $294 within three months.

    Now that the memecoin frenzy is gone, Solana finds itself with no major project on its chain except them.

    The road ahead for Solana would depend on how fast it could realign itself with new market realities like Real World Assets, DePIN, and other projects with long-term viaibility.

  • Mantra’s 13 April Dump Was Predicted on 27 March 2025

    • Mantra (OM) falls 90% in the last 24 hours.
    • Market participants speculate that the fall was a result of pump and dump.
    • I had previously cited glaring defects in Mantra’s tokenomics with 52% of token supply being held by 10 accounts.

    Mantra Crashed 85% within a single day bringing almost $5 billion worth of value to zero. I had previously predicted this fall on 27th March 2025, citing the serious trouble with Mantra’s tokenomics.

    Though this appears to be a textbook pump-and-dump scheme, the CEO of Mantra has denied this. Still, the bad tokenomics would be the largest aspect to blame for this 90% crash.

    Mantra’s Fall Was Inevitable, I Had Predicted on 27 March

    Mantra's Fall Was Already Visible Since at least 27 March 2025

    For IP reasons, I cannot post a link to this original page, however above is a screenshot of what I thought for Mantra 2 weeks before its failure.

    70% of Users Who Bridged Tokens Ineligible For Reward

    Mantra had previously announced a reward program where its users were required to bridge their tokens in exchange for Galxe rewards.

    Upon bridging, as many as 70% of users were found to be ineligible for the rewards program.

    This was the reason that brought my attention to Mantra’s other aspects like project readiness, tokenomics, and other areas.

    Seriously Disturbed Tokenomics

    Mantra’s most disturbing aspect was its tokenomics where the top 10 accounts controlled more than 52% of the token supply. Despite being at least a 6-month-old project, Mantra’s too-high token concentration was a serious red flag.

    Now that we know the tokens were pumped and dumped, we suspect either the token was held in multiple accounts to show decentralized ownership or were distributed to a very close network of investors. Otherwise, such a seemingly-coordinated sell-off would never had happened.

    Mantra's Tokenomics Before Fall
    Mantra’s Tokenomics on 27 March 2025, 14 Days Before Fall

    Anyone who has been investing in the crypto markets understands that centralized tokenomics is a ticking time bomb. Even if any single large token holders panic, we would see a spiraling down crash.

    Even if we believe that Mantra’s crash was not a pump-and-dump scheme, it would still be the fault of its skewed tokenomics. A sale by one of the top whales in a liquidity-dried market would easily cause most of the other holders to sell their holdings.

    Avoid Catching the Falling Knife

    At current prices, it would seem like a steal to buy OM, however, we seek to caution our readers that this could be akin to catching a falling knife. Mantra has already seen a 90% crash (for whatever reason) and is unlikely to see a recovery anytime soon.

    For those who are still willing to invest, I would caution them to only invest as much as they can afford to lose in a wager.

  • 4 Indicators Signal Bitcoin’s Upcoming Rally Above $100k

    • Bitcoin seems to be gathering momentum to cross $100k.
    • Strong chart patterns, higher open interest, upcoming FOMC meetings, and corporate buying have been pushing Bitcoin higher.
    • Going forward, Bitcoin may encounter resistance near $85k and $95k before recovering above $100k.

    Bitcoin has been showing very strong signs of an upcoming rally. Chart experts attribute this rally to strong price patterns amid strong fundamentals. Another reason for this expected rally seems to be corporate buying based on the strong possibility of a rate cut in the May 6-7 FOMC meeting.

    1. Technical Charts Indicate Breakout

    Two chart experts, both of whom are known for their high accuracy are bullish on Bitcoin undergoing a recovery rally in the next few weeks.

    Ali Martinez Shows Bitcoin Crossing 50D SMA

    Crypto chart expert Ali Martinez thinks Bitcoin might cross above its 50 SMA followed by its 200 SMA.

    Bitcoin is about to move above its 50-day simple moving average (SMA), an event that occurs only when Bitcoin’s short-term momentum has been increasing. This momentum increase is critical in helping Bitcoin break out of its bearishness.

    Above the 50 SMA, Bitcoin is expected to encounter a resistance at $87,250. Upon conquering this resistance, Bitcoin might rise further towards $94,100.

    Rekt Capital Expects Bitcoin to Start a Rally After $86,900

    Rekt Capital, one of the most accurate analysts having correctly forecasted Bitcoin’s pre-halving and post-halving behavior in 2024, now thinks that beyond $86,900 Bitcoin might start another rally towards $93,700.

    2. Open Interests Surge

    In the last 30 days, Bitcoin’s Futures open interest (OI) increased by 30% from $45 billion to $58 billion. This rise in OI is oftentimes a precursor to the rising demand for Bitcoin.

    Data from Coinglass clearly captures this rise between March 12 and April 13.

    Bitcoin Futures Saw 30% Increase in Open Interest Last Month
    Bitcoin Futures Saw 30% Increase in Open Interest Last Month

    Open Interest is used as an indicator of the market’s participation level in any crypto or stock. It is believed that a higher OI is a result of greater market participation.

    3. Fed’s Next FOMC Meeting on May 6-7

    The US Fed is expected to cut interest rates by at least 0.25% in its upcoming FOMC meeting on May 6-7, 2025. The possibility of a rate cut is higher this time due to lower inflation in March 2025 (at 2.4%).

    This interest rate cut is expected to help crypto and stock markets recover from a liquidity crisis that was present in the first quarter of 2025 (Jan – Mar).

    In its last FOMC meeting (March 18-19), the US Federal Reserve disclosed that it has stopped quantitative tightening (reducing money in the economy) and would begin quantitative easing (increasing money in the economy via lowering interest rates).

    4. Strong Corporate Buying

    In the last month, crypto corporates like GameStop, Strategy, Metaplanet, Marathon Digital, and many smaller players have bought at least $3 billion worth of Bitcoin, with additional plans to purchase at least $20 billion more in 2025.

  • US Fed Might Cut Rates by 0.25% As Inflation Cools to 2.4%

    • The US Consumer Prices Index (inflation) was at 2.4% against expectations of 2.6%.
    • A lower inflation was necessary for a rate cut in the May 6-7 FOMC meeting.
    • The US Federal Reserve is likely to go for at least a 0.25% rate cut.
    • Bitcoin might recover above $100k and Altcoin markets are expected to recover at least 30% to 50% following the rate cut.

    US Consumer Price Index at 2.4% vs Estimates of 2.6%

    The US Consumer Prices Index (inflation) for the month of March 2025 came at 2.4%, close to the 2% target of the US Federal Reserve. Markets estimated the inflation numbers to be at 2.6% for March 2025. Last month, in Feb 2025, the CPI came at 3.1%.

    Lower CPI numbers are critical for a rate cut because they signal a cooling inflation. A cooled-down inflation is a necessary precursor to avoid any hyperinflation (inflation above 10% in the USA) scenario.

    Since these inflation numbers for March 2025 were the last one before the US Fed FOMC meeting next month, it would prove critical for them to take a dovish way ahead (i.e., help to cut interest rates). An inflation of 3% or higher would have forced the US Fed to go for a delayed interest rate cut.

    Will the US Fed Cut Rates? How Much?

    The US Fed is most likely to cut interest rates at least by 0.25% and at max by 0.5%. If done, the effective Federal Funds rate would be around 5.12% (a window of 5% to 5.25%) from the current 5.37% (a window of 5.25% to 5.5%).

    The reason why we strongly believe in a rate cut ahead is because of the guidance provided by the US Fed in its March 18-19 meeting. The Fed said that starting from April 2025, it would begin quantitative easing, a term used to denote the act of a central bank to infuse liquidity (money) in an economy.

    Effect of US Federal Reserve’s Rate Cut

    This reduced federal funds rate would help lower interest rates on loans and discourage more people from saving which will help the dollars find their way into the economy.

    As a result, crypto and stock markets could see a major rally between 10% to 20%. This rally could give a major boost to the global economy in the short term amid a bitter US-led global tariff war.

    Relation Between US Fed Rates and Inflation

    In any economy, the role of setting monetary policy is played by the central bank of that country or economy, for example, the Federal Reserve System in the USA, the European Central Bank in the EU, and the Reserve Bank in India.

    A monetary policy basically maintains the supply of money in that country. If the money supply is too high, there would be high inflation whereas if it is too low, the economy would see a recession.

    To increase the monetary supply, the central bank lowers the interest rate and lends money at a cheaper rate to the banks. To reduce the monetary supply, it raises interest rates so that people save more with bonds and the loan interest rates also increase, which then sucks all the excess money from the economy.

    Main Roles of a Central Bank in an Economy with List of 5 Central Banks
    Main Roles of a Central Bank in an Economy with a List of Top 5 Central Banks

    In the US Economy, this role is played by the US Federal Reserve which makes interest rate decisions based on factors like economic activity, jobs data, inflation figures, and a few other numbers. Among them, inflation plays the largest role. The US Federal Reserve is supposed to keep inflation between 0% to 2%.

  • FTX/Alameda Solana Unstaking Too Small to Impact SOL Price

    • FTX unlocked $21.5 million worth of Solana on 11 April 2025.
    • The bankrupt exchange which is in the process of repaying customers, will likely sell the crypto.
    • Solana remains untouched by the selling, on the contrary, it was up 7% at press time.
    • FTX’s total holdings on the Solana blockchain stand at $398 million as per Arkham Intelligence.

    The FTX Bankruptcy Estate (which includes Alameda Research) has unstaked $21.5 million worth of Solana. The amount has been unlocked possibly for selling. The bankrupt exchange (FTX) and its sister concern (Alameda), have almost come out of their bankruptcy and have paid most of their retail customers (claims below $50k).

    The exchange is now in the process of paying its large customers ($50k+ claims), post which it will have to pay various agencies like the Department of Justice, the SEC, and the IRS.

    FTX Unstaking Solana, Source: Cointelegraph on X.com
    FTX Unstaking Solana, Source: Cointelegraph on X.com

    The unstaking of 186,326.18 SOL is not enough to put the markets in a tight spot but is enough to initiate an avalanche effect (snowstorm) on Solana’s price.

    Solana’s Recent Price History

    Solana has seen a steep slide from $294 on Jan 19, 2025, to $96 on April 9, 2025. This steep slide was caused by the lack of liquidity in the crypto markets and hawkish guidance by the US Fed after its Jan 28-29 meeting.

    Solana Price History Last 6 Months With Supports and Resitances
    Solana Price History Last 6 Months With Supports and Resitances

    Further, the end of the Memecoin Supercycle also impacted Solana’s on-chain fee revenue, leading to a further loss.

    At press time, Solana was trading at $120, 7% above its bull market support level of $114. Below this support level, Solana could crash down to $100. The longer Solana holds to this support level, it gets more “courage” to make a recovery rally above $125.

    After the $125 resistance, Solana could easily cross $140 and $170. We expect these to happen by the next FOMC meeting on May 6-7.

    Why FTX’s Sale is Unlikely to Impact Solana?

    Insignificant Amount

    The possible sale of 186k SOL by the FTX estate is unlikely to impact Solana’s price due to the sheer demand for it in the current market. At press time, Solana’s last 24-hour volume was at $4.3 billion, way higher than the sale value of FTX.

    Expected Pre-Launch Demand from Solana ETFs

    Further, the impending approval of Solana ETFs is also likely to absorb the impact of any upcoming sell-off. We have witnessed ETF issuers buying up a certain amount of crypto before listing their ETFs.

    For example, when the IBIT Bitcoin ETF was about to be launched in Jan 2024, BlackRock, the ETF issuer bought nearly $2 billion worth of Bitcoins from the open market.

    In the case of Solana ETFs, which are possibly due for approval in May 2025, might create a similar demand for SOL.

    No Avalanche Effect

    Many of us were previously concerned with the possibility that FTX unlocks will possibly trigger a massive sell-off in crypto markets, especially in SOL. However, now that the markets are at least 20% up from previous levels, they are unlikely to trigger any such condition.

    Insignificant SOL Holdings

    Even if FTX decides to withdraw all of its crypto on the Solana blockchain, convert them back to SOL, and sell them off, it would still be able to sell only $400 million worth of SOL at current valuations.

    FTX Holdings by Chain, Source: Arkham
    FTX Holdings by Chain, Source: Arkham

  • Smart Whales Buying Ethereum While 71% Retailers Think It as Loser

    A survey conducted by crypto chart expert Ali Martinez shows that the crypto markets overwhelmingly think that Ethereum is the biggest loser in the 2025 crypto market corrections.

    The reason for the overwhelming response seems to be Ethereum’s fall from $4000 on Dec 6, 2025, to $1400 today i.e., April 9, 2025.

    However, despite the fall, Ethereum continues to lead the markets in all fundamental factors, be it on-chain TVL, stablecoins, fee revenue, or dApp statistics. Ethereum beats all chains multiple times over. This is true even for Bitcoin, which only managed to generate 33% of revenue as compared to Ethereum.

    This could be the reason why crypto whales have been accumulating Ethereum at aggressive levels. Crypto reporting platform on X.com, CryptoGoos presented data for whale accumulation (via Cryptoquant).

    Summarizing Ethereum’s Strong Fundamentals

    Despite its price performance in the last three to four months, Ethereum is still the strongest blockchain in all of crypto markets based on our research.

    Central Role in Crypto Markets

    Ethereum has been the innovator and guiding beacon in the defined markets. Clearly, it has become a leader as DeFi applications and use cases grew.

    At present, Ethereum directly has a $50 billion TVL and $120 billion of on-chain stablecoins, far greater than any other blockchain. It indirectly supports at least 75% of the DeFi markets by acting as a reference standard for chains like BNB, Tron and Berachain.

    Highest On-Chain Revenue

    Last year Ethereum managed to generate an on-chain fee revenue of $2.5 billion while others remained far below it the second highest revenue was generated by the Tron Blockchain at $2.1 billion and it even beat Bitcoin by a factor of 300%, as Bitcoin generated a revenue of nearly $750 million.

    Other revenue sources like ENS domains also contribute to Ethereum’s fross revenue.

    Supports Entire Layer-2 and Layer-3 Network

    Ethereum places central role in the DeFi markets supporting over 60 blockchains, more than 140 Layer-2 and Layer-3 solutions and several other applications. Almost all of the DeFi markets either depend on Ethereum directly or are compatible with the EVM virtual machine.

    Analyzing ETH’s Fall. Will it Recover?

    Ethereum’s 63% fall over the last one quarter clearly has spooked the market. At present Ethereum is already in a oversold territory and could gain clearly from this stage. At Blockchain Lab, we believe that Ethereum has already formed its bottom at $1400, based on its recent price behavior.

    Ethereum Price Behavior in Last 12 Months
    Ethereum Price Behavior in Last 12 Months, Source: CMC

    Coming on to Ethereum ETFs, the underperformance is due to a regulatory reason and is completely solvavle.

    Ethereum ETFs are only disliked in the ETF markets because of their inability to provide staking benefits, a critical source of income for Ethereum holders in the spot markets. If these Etherium ETFs under Donald Trumps Administration are allowed to re file and provides taking benefits we might see a sudden demand for them in the ETF markets.

    Our analysis suggests that it might recover very soon in the crypto markets and this recovery will be aided by a complete change in crypto market regulations around the world. In the long term we expect ETH to establish itself as the largest cryptocurrency possibly beating Bitcoin by the turn of this decade.